One of the cool things about having a notebook inside a Power BI workspace is all the cool things pyspark can do. I wanted a way to quickly generate a data model to demo Direct Lake so I created this script for notebook.

This script creates 3 dimension tables, 1 measure table, and as many fact tables you would like with as many rows as you would like. This way I could try it out with 100 tables with 10,000 rows or 1 fact table with 1 billion rows! (The billion rows takes usually 5-10 minutes to run.)
The fact tables have keys that match to the dimension tables. The measure table is just a placeholder you can use in web modeling to add measures to if you like to have a separate measure table.
The dimensions it creates is a small dimension for Product Category with 4 values, and a larger dimension for Geography with Australia and USA with their states/territories. Finally, the last dimension is a Date table.
Ok! So here is how to set up the Lakehouse with some delta tables:
1) Enable the Fabric trial on your tenant (if not already)
2) Create a new workspace using the trial capacity (or use an existing one)

3) In this workspace, go to New

4) Then go to Show all
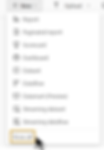
5) Then pick a Notebook (Preview)

6) Click "Add" to create a lake house to put the data


7) Give it a name (it can't have spaces!)

8) Paste in the script, and adjust the number of fact tables and rows

(Optional) You can adjust the date range, but if you do then you need to adjust it in line 87 as well for the fact table.
(Optional) You can also adjust the dimensions if you like
9) Give the notebook a better name (Click the Notebook name, then type in a new name and hit enter or click somewhere else)
10) Run the script (Click the little play icon)
11) Go back to the Workspace (Click the Notebook name, then click the Workspace name or click it in the right border pane) and you should see the Notebook, Lakehouse, SQL endpoint, and default dataset all created

The script:
# How many rows should be in the fact table?
num_rows_in_facts = 10000
# How many fact tables do you want in your model?
num_fact_tables = 1


# Let's create a date table!
import pandas as pd
from pyspark.sql.functions import col, last_day, dayofweek, year, month, date_format

# if you adjust these, make sure to adjust the fact table generation as well
start_date = '2020-01-01'
end_date = '2023-12-31'
years = 4


date_df = pd.date_range(start=start_date, end=end_date).to_frame(index=False, name='Date')
date_df['Date'] = date_df['Date'].astype(str)

spark_df = spark.createDataFrame(date_df)

spark_df = spark_df.withColumn('Date', col('Date').cast('date'))
spark_df = spark_df.withColumn('DateID', date_format(col('Date'),"yyyyMMdd").cast('integer'))
spark_df = spark_df.withColumn('Monthly', date_format(col('Date'),"yyyy-MM-01").cast('date'))
spark_df = spark_df.withColumn('Month', date_format(col('Date'),"MMM"))
spark_df = spark_df.withColumn('MonthYear', date_format(col('Date'),"MMM yyyy"))
spark_df = spark_df.withColumn('MonthOfYear', month(col('Date')))
spark_df = spark_df.withColumn('Year', year(col('Date')))
spark_df = spark_df.withColumn('EndOfMonth', last_day(col('Date')).cast('date'))
spark_df = spark_df.withColumn('DayOfWeekNum', dayofweek(col('Date')))
spark_df = spark_df.withColumn('DayOfWeek', date_format(col('Date'),"EE"))
spark_df = spark_df.withColumn('WeeklyStartSun', col('Date')+1-dayofweek(col('Date')))
spark_df = spark_df.withColumn('WeeklyStartMon', col('Date')+2-dayofweek(col('Date')))
spark_df.show()

spark.sql("DROP TABLE IF EXISTS date")
spark_df.write.mode("overwrite").format("delta").saveAsTable('date')


# A table to store the measures in the model

data = [(1, 'Measures only')]
columns = ['ID', 'Col1']

measure_df = spark.createDataFrame(data, columns)
measure_df.show()

spark.sql("DROP TABLE IF EXISTS measuregroup")
measure_df.write.format("delta").saveAsTable('measuregroup')


# A small dimension table

data = [(1, 'Accessories'), (2, 'Bikes'), (3, 'Clothing')]
columns = ['ProductCategoryID', 'ProductCategory']

product_df = spark.createDataFrame(data, columns)
product_df.show()

spark.sql("DROP TABLE IF EXISTS productcategory")
product_df.write.format("delta").saveAsTable('productcategory')


# a larger dimension table, with USA and Australia and their states/territories

data = [(1, 'Alabama', 'USA'),(2, 'Alaska', 'USA'),(3, 'Arizona', 'USA'),(4, 'Arkansas', 'USA'),(5, 'California', 'USA'),(6, 'Colorado', 'USA'),(7, 'Connecticut', 'USA'),(8, 'Delaware', 'USA'),(9, 'Florida', 'USA'),(10, 'Georgia', 'USA'),(11, 'Hawaii', 'USA'),(12, 'Idaho', 'USA'),(13, 'Illinois', 'USA'),(14, 'Indiana', 'USA'),(15, 'Iowa', 'USA'),(16, 'Kansas', 'USA'),(17, 'Kentucky', 'USA'),(18, 'Louisiana', 'USA'),(19, 'Maine', 'USA'),(20, 'Maryland', 'USA'),(21, 'Massachusetts', 'USA'),(22, 'Michigan', 'USA'),(23, 'Minnesota', 'USA'),(24, 'Mississippi', 'USA'),(25, 'Missouri', 'USA'),(26, 'Montana', 'USA'),(27, 'Nebraska', 'USA'),(28, 'Nevada', 'USA'),(29, 'New Hampshire', 'USA'),(30, 'New Jersey', 'USA'),(31, 'New Mexico', 'USA'),(32, 'New York', 'USA'),(33, 'North Carolina', 'USA'),(34, 'North Dakota', 'USA'),(35, 'Ohio', 'USA'),(36, 'Oklahoma', 'USA'),(37, 'Oregon', 'USA'),(38, 'Pennsylvania', 'USA'),(39, 'Rhode Island', 'USA'),(40, 'South Carolina', 'USA'),(41, 'South Dakota', 'USA'),(42, 'Tennessee', 'USA'),(43, 'Texas', 'USA'),(44, 'Utah', 'USA'),(45, 'Vermont', 'USA'),(46, 'Virginia', 'USA'),(47, 'Washington', 'USA'),(48, 'West Virginia', 'USA'),(49, 'Wisconsin', 'USA'),(50, 'Wyoming', 'USA'),(51, 'New South Wales', 'Australia'),(52, 'Queensland', 'Australia'),(53, 'South Australia', 'Australia'),(54, 'Tasmania', 'Australia'),(55, 'Victoria', 'Australia'),(56, 'Western Australia', 'Australia'),(57, 'Australian Capital Territory', 'Australia'),(58, 'Northern Territory', 'Australia')]
columns = ['GeoID', 'StateOrTerritory', 'Country']

geo_df = spark.createDataFrame(data, columns)
geo_df.show()

spark.sql("DROP TABLE IF EXISTS geo")
geo_df.write.format("delta").saveAsTable('geo')


# This one has no upward trending

# loop to create fact tables with random links to the above dimensions
# and a sales column with random generated numbers (1-1000)
# and a costs column with random generated numbers (1-100)

from pyspark.sql.functions import rand, randn, expr

dfs = []
for i in range(1, num_fact_tables+1):
    df = spark.range(0, num_rows_in_facts).withColumn('ProductCategoryID', (rand(seed=i)*3+1).cast('int')).withColumn('GeoID', (rand(seed=i)*58+1).cast('int')).withColumn('DateID', expr('cast(date_format(date_add("2020-01-01", cast(rand(100) * 365 * 4 as int)), "yyyyMMdd") as int)')).withColumn('Sales', (rand(seed=i*4)*1000+1).cast('int')).withColumn('Costs', (rand(seed=i+45)*100+1).cast('int'))
    dfs.append(df)
    df_name = 'df_{}'.format(i)
    globals()[df_name] = df
    print("Name is sales_{} with {} rows.".format(i, df.count()))
    spark.sql("DROP TABLE IF EXISTS sales_{}".format(i))
    df.write.format("delta").saveAsTable('sales_{}'.format(i))
Now let's create a data model. A default dataset (data model) is created for you, but I'll show you how to create a custom one that opens in the Power BI web modeling experience. Direct Lake is only available in web modeling as of July 2023.
1) Click on the Lakehouse artifact

2) Click on "New Power BI dataset"

3) Click "Select all" on the New dataset dialog

4) Now you are in the web modeling experience!

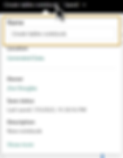
5) First let's give this data model a better name (Click on the Name in top left, then type in a new name and hit enter or click somewhere else)

To set up this data model, I did the following. You can set it up how you like!
1) Relationships: Drag the [DateID] from 'sales_1' to 'date' (the dialog here defaults to Many-One so dragging from the fact table to the dimension will make sure it's in the correct direction), check "Assume referential integrity", then click "Confirm".


2) Relationships continued: Do the same for [GeoID] and [ProductCategoryID] to their respective dimension tables. If you accidently pick the wrong column or forget to check "Assume referential integrity", you can single click on the relationship line and edit it in the properties pane!

3) Measure for Sales: Click on 'measuregroup' then click 'New measure' then type in Sales = SUM('sales_1'[sales]). In the properties pane, change the Format to "Currency"


4) Measure for Costs: Same as above except Costs = SUM('sales_1'[Costs])
5) Measure for Profit: Profit = [Sales] - [Costs]
6) Measure for Profit Margin: Profit Margin = DIVIDE([Profit],[Sales]) and format as Percentage instead of Currency.
7) Create measure table: Hide the Col1 and ID in the 'measuregroup' table by clicking the little eye that shows when you hover. Now it should change icon and show at the top of the Data pane!

8) Date table formatting: I'm a bit picky when it comes to how my dates show so I use the Custom option and change [Date] to dd mmm yyyy, [Monthly] to mmm yyyy, [WeekStartMon] and [WeekStartSun] to "Week starting " dd mmm yyyy (ddd)


9) Date ordering: I'm also picky about what order my text month columns show, the Monthly column in a date column so it orders correctly as is, so I click on [Month] then in properties pane expand "Advanced" and set "Sort by column" to [MonthOfYear]. I do the same for [MonthYear] and set "Sort by column" to [Monthly]. And finally for [DayOfWeek] set "Sort by column" to [DayOfWeekNum]


10) Data category for geo fields: The 'geo' table columns should be set the right data category for maps, so in the properties pane expand "Advanced" and set the "Data category" to "Country/Region" for [Country] and "State or Province" for [StateOrTerritory].


11) Hiding fact table: I have dimension tables and measures I want my report creators to use instead of the fact table columns directly, so I will hide the fact table 'sales_1' by click the little eye when I hover over the table.

Wonderful, all done! Now I can create a report. You can click "New report" here to create it in the web, but I find it easier to create in Power BI Desktop, so let's create a report in Power BI Desktop:
1) Open Power BI Desktop and login
2) Go to Home > Get data > Power BI datasets

3) Then click the data model you just created, mine is called a very clever "My data model"

4) Now you create your report! I added a multi-card with my measures, and a combo chart with Sales and Profit Margin by Monthly

5) Once done, publish to the Power BI service


And that's it! Now you can see the report and you didn't have to set up a refresh or bring data into data model, it's getting it directly from the Lakehouse parquet delta tables using Direct Lake!